


Turn ideas into working apps with plain English - no code, Stripe ready.
Get startedNMS Explained: Step-by-Step Guide with Python
Understanding how Non-Maximum Suppression refines object detection predictions
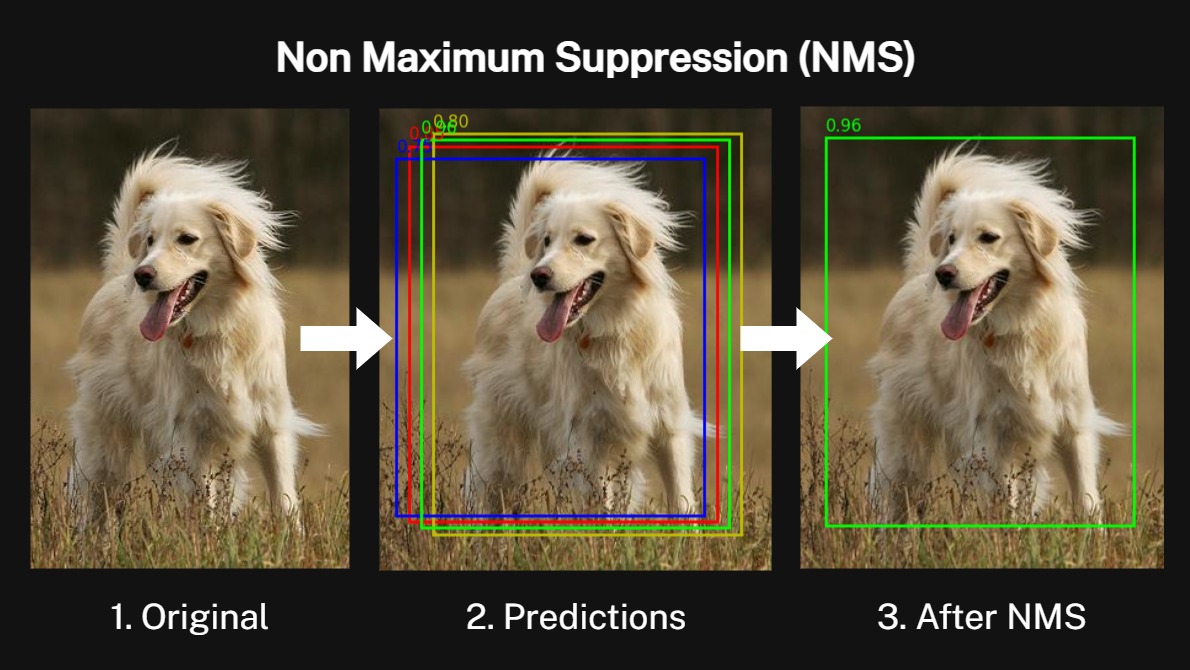
In modern object detection, models often predict multiple overlapping bounding boxes for the same object.
These redundant boxes, if left unchecked, can create confusion for applications like counting objects or tracking.
Non-Maximum Suppression (NMS) is the technique that resolves this by selecting the most confident predictions and discarding overlapping ones.
Generating Bounding Box Predictions
Consider an example where the objective is to detect a Golden Retriever given an image. That is, we want to find a bounding box, , that best localizes the Golden Retriever.
Your object detection model might predict multiple bounding boxes around the same Dog.
Where is the confidence score of the predicted bounding box .
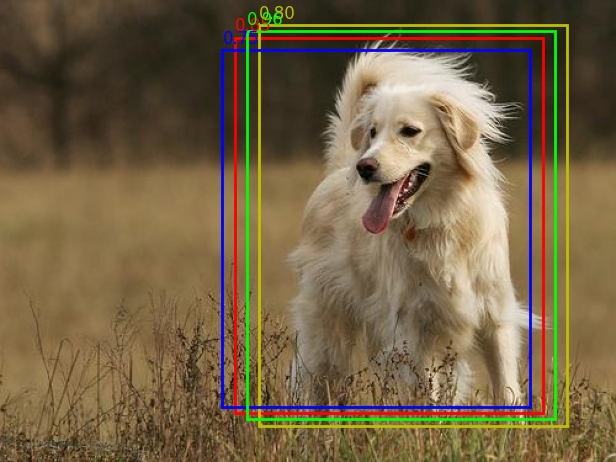
These multiple predictions create noise, and make it difficult to use the predictions in any meaningful way.
The goal is to filter these bounding boxes in such a way that the bounding box with the highest confidence score is retained.
Any other bounding box that has an greater that a chosen threshold () is dicarded.
Even though these boxes are close, only one should ideally represent the object. This is where NMS comes in.
Measuring Overlap: Intersection over Union (IoU)
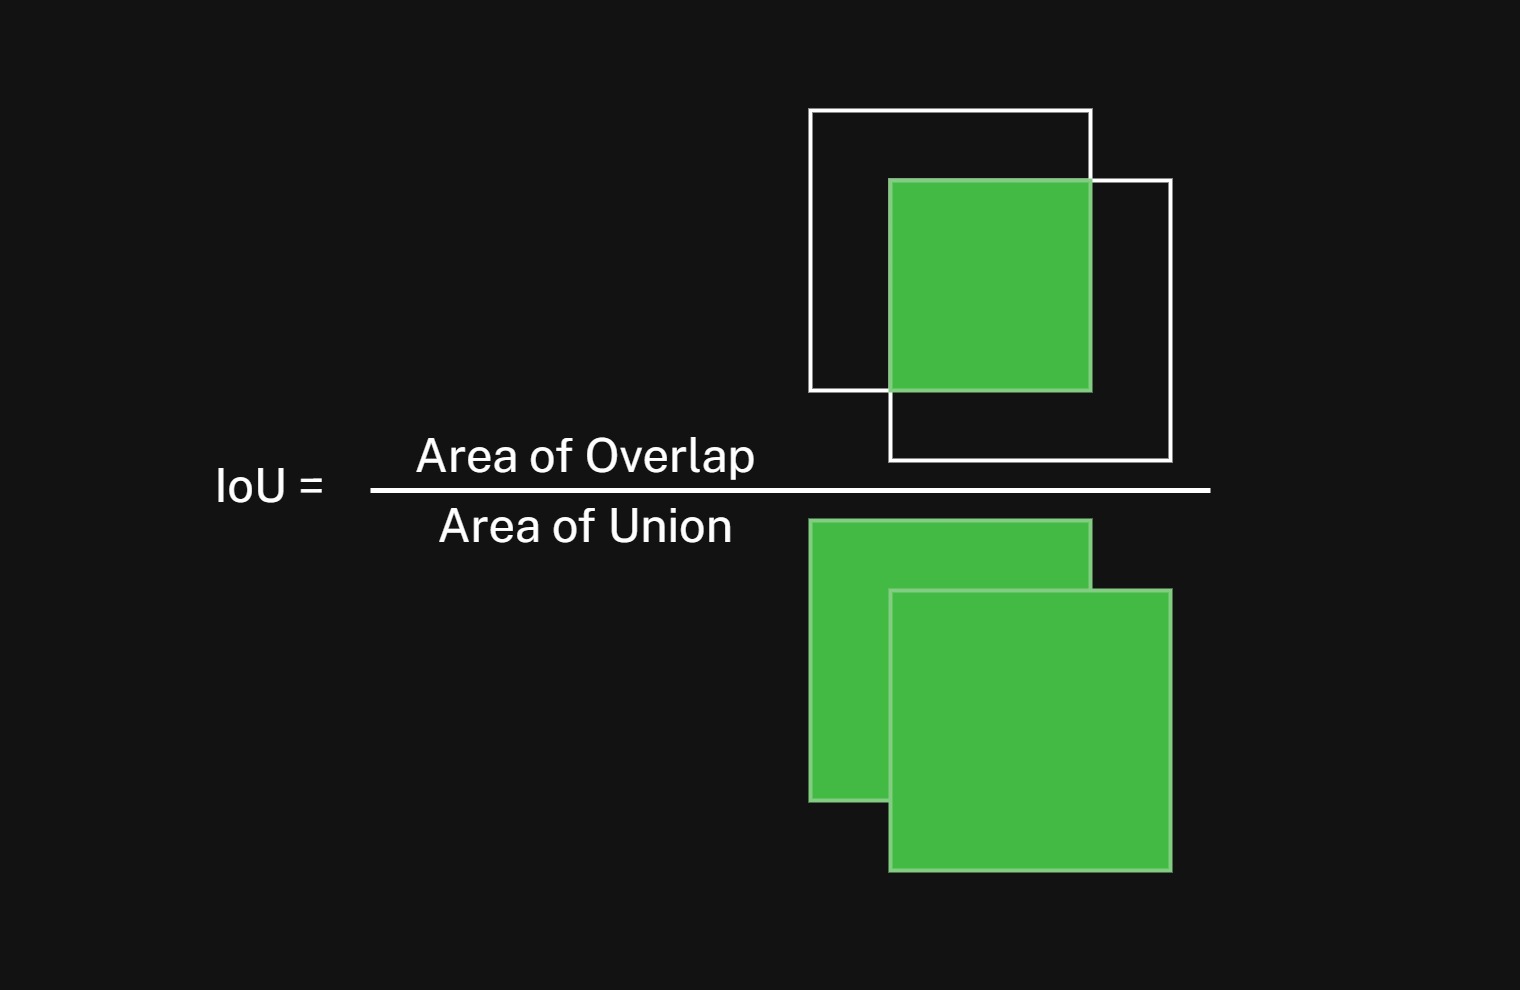
The core idea is to measure how much two boxes overlap. This is quantified by the Intersection over Union (IoU):
→ boxes perfectly overlap
→ no overlap
All code used in this guide can be accessed on this GitHub Repository.
def iou(box1, box2):
    x1 = max(box1[0], box2[0])
    y1 = max(box1[1], box2[1])
    x2 = min(box1[2], box2[2])
    y2 = min(box1[3], box2[3])

    inter_area = max(0, x2-x1) * max(0, y2-y1)
    box1_area = (box1[2]-box1[0]) * (box1[3]-box1[1])
    box2_area = (box2[2]-box2[0]) * (box2[3]-box2[1])

    return inter_area / (box1_area + box2_area - inter_area)
How NMS Works
Non-Maximum Suppression follows a simple, intuitive logic:
Sort all predicted boxes by confidence scores in descending order.
Select the highest-scoring box and add it to the final detections.
Remove all remaining boxes that have IoU with greater than a threshold .
Repeat until no boxes remain.
Mathematically, for each box :
where is all the boxes in the image.
def non_max_suppression(boxes, scores, iou_threshold=0.5):
    boxes = np.array(boxes)
    scores = np.array(scores)
    indices = np.argsort(scores)[::-1]
    keep = []

    while len(indices) > 0:
        current = indices[0]
        keep.append(current)
        rest = indices[1:]
        ious = np.array([iou(boxes[current], boxes[i]) for i in rest])
        indices = rest[ious <= iou_threshold]

    return boxes[keep], scores[keep], [i for i in keep]
Visualizing Predictions and NMS
We can represent predictions visually to see the effect of NMS.
Each box is drawn with a unique color, and confidence scores are annotated:
def plot_boxes(image, boxes, scores=None, title="", filename=None, colors=None):
    fig, ax = plt.subplots(figsize=(8,6))
    ax.imshow(image)

    for i, box in enumerate(boxes):
        x1, y1, x2, y2 = box
        rect = patches.Rectangle(
            (x1, y1), x2-x1, y2-y1,
            linewidth=2,
            edgecolor=colors[i] if colors else 'w',
            facecolor='none',
        )
        ax.add_patch(rect)
        if scores is not None:
            ax.text(
                x1, y1-5, f"{scores[i]:.2f}",
                color=colors[i] if colors else 'w',
                fontsize=12
            )

    plt.axis('off')
    if filename:
        plt.savefig(filename, bbox_inches="tight", pad_inches=0)
    plt.show()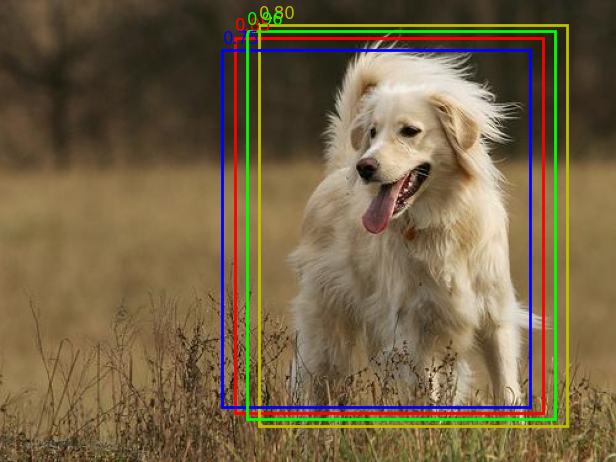
NMS Result
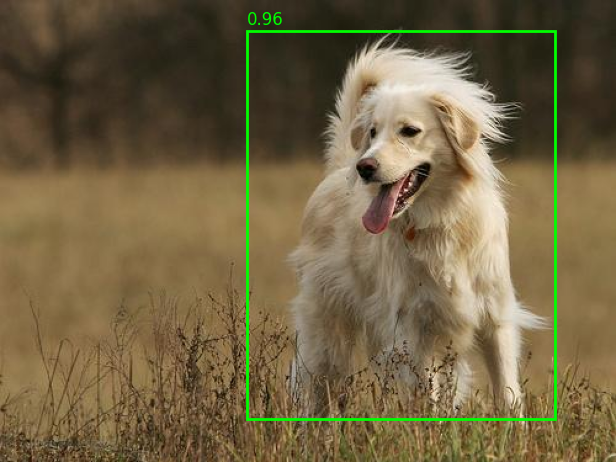
The result of NMS is the final bounding box that best represents the object as illustrated by the following. A Threshold of 0.5 is chosen for this example.
threshold = 0.5

nms_boxes, nms_scores, keep_indices = non_max_suppression(boxes, scores, iou_threshold=threshold)
kept_colors = [colors[i] for i in keep_indices]

plot_boxes(
    image,
    nms_boxes,
    scores=nms_scores,
    title=f"NMS Filtered Boxes (IoU={threshold})",
    filename=f"nms_{int(threshold*100)}.png",
    colors=kept_colors
)
Effect of IoU Thresholds
NMS ensures that each object is represented by a single bounding box, prioritizing the most confident predictions. The IoU threshold determines how aggressive the suppression is. Choosing the right IoU threshold is crucial:
Low threshold (0.3): even slightly overlapping boxes are removed
High threshold (0.7): only highly overlapping boxes are removed
An understanding of how your detection model works is crucial in determining what the threshold should be.
Summary
Non-Maximum Suppression is a simple yet essential step in object detection pipelines. By combining confidence scores and IoU-based suppression, it reduces redundancy and ensures clearer, more precise predictions.
Confidence score guides which box is preferred.
IoU threshold controls overlap tolerance.
Visualization helps understand the algorithm’s behavior.
Read More
Read more articles on the topics that interest you

Solar Cost for Small Businesses in South Africa: Ranges
See what different system sizes include, where extra costs hide, and how to compare quotes

How to Buy Bitcoin in South Africa Legally in 5 Steps
Choose a provider, pay in rand, check the costs and keep tax records

How to Build a Full-Stack Web App With AI in 7 Steps
Adapt a starter project, then use AI to build, test and launch your first working version

Best AI Website Builders for Beginners in 2026: 5 Picks
Compare easy site creation, online selling, costs and the trade-offs before you choose
Jobs most likely to be replaced by Artificial Intelligence
Exploring careers at risk due to AI advancements and automation

How to start an AI business in South Africa
Essential steps for launching an AI venture in South Africa